Understanding the Fundamentals of Trading View
In the rapidly evolving landscape of financial markets, traders and investors require robust tools to analyze, monitor, and execute trades with confidence. One of the most prominent platforms meeting these needs is trading view. This comprehensive platform combines cutting-edge charting capabilities, social trading features, and a wide array of analytical tools, making it an indispensable resource for both novices and seasoned professionals. To harness its full potential, it’s crucial to understand what Trading View is and how it operates within the modern trading ecosystem.
What is Trading View and How Does It Work?
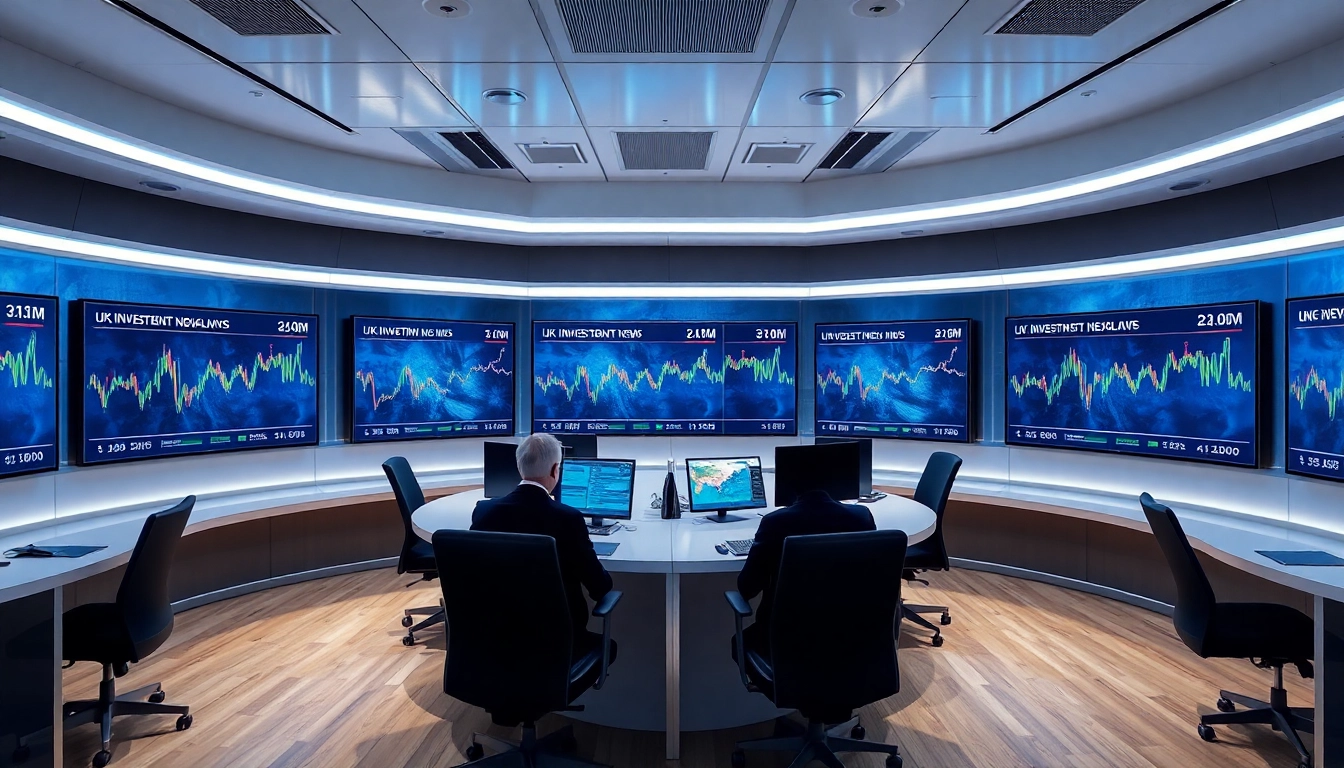
Trading View is a web-based platform designed for market analysis, charting, and social interaction among traders. It provides real-time data across virtually all major asset classes, including stocks, cryptocurrencies, commodities, forex, and indices. Its intuitive interface allows users to access advanced charting tools, technical indicators, and scripting features that facilitate in-depth analysis.
At its core, Trading View functions as a social network for traders, enabling sharing of ideas, strategies, and insights. This community-driven approach fosters collaborative learning and collective intelligence, setting it apart from traditional, solitary trading software. Additionally, Trading View integrates with numerous brokerage platforms, allowing traders to execute trades seamlessly from the same interface.
The platform’s cloud-based architecture ensures accessibility across devices, including desktops, tablets, and smartphones. Whether you’re analyzing charts on your desktop or assessing market movements on the go via the mobile app, Trading View maintains consistency and real-time responsiveness.
Key Features and Tools for Traders
Advanced Charting and Technical Analysis
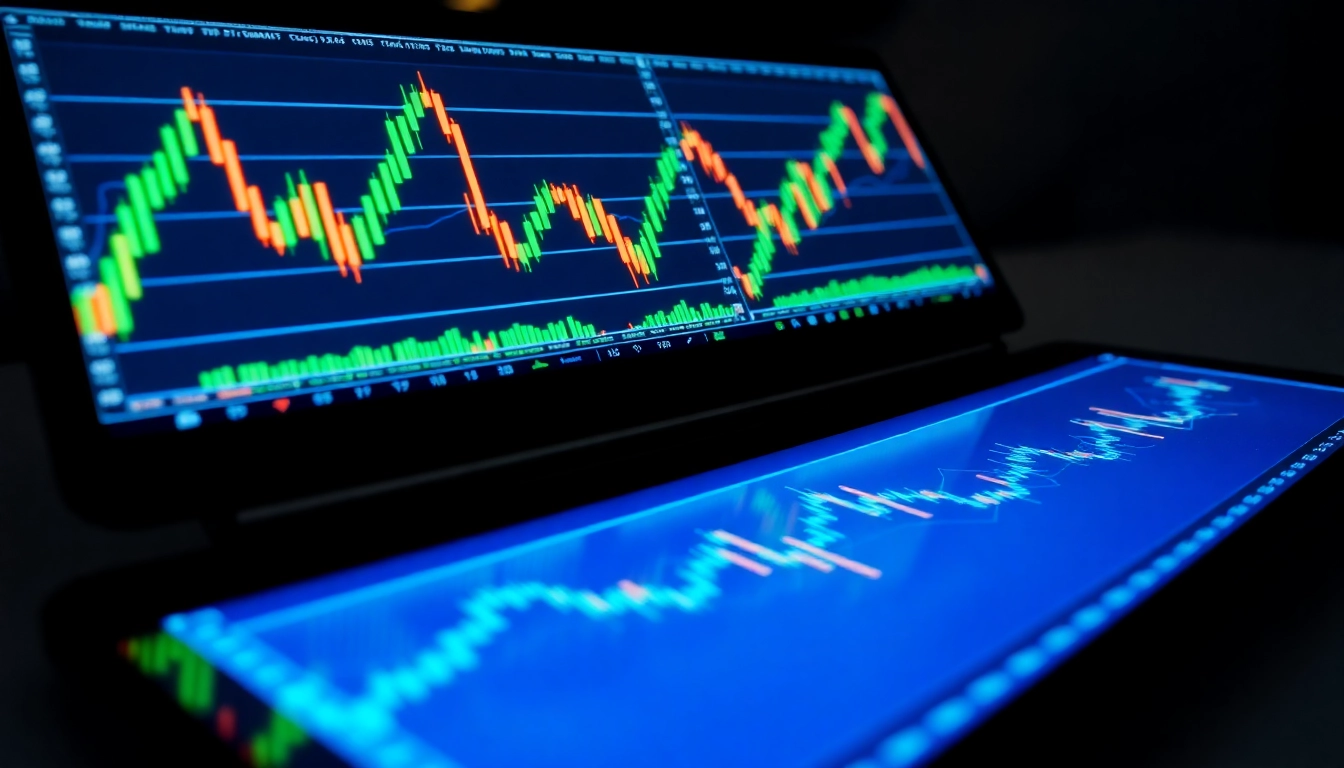
Trading View offers a rich library of chart types—line, bar, candlestick, Renko, Kagi, and more—each suited for different analytical approaches. The platform’s technical indicator repository exceeds 100 built-in options, including Moving Averages, RSI, MACD, Bollinger Bands, and Fibonacci tools. Traders can layer multiple indicators, customize parameters, and combine them to identify trend strength, reversals, and trading signals.
Customizable Watchlists and Alerts
One of Trading View’s standout features is its customizable watchlists, allowing traders to monitor specific assets and market sectors efficiently. Alerts can be set for price levels, indicator crossovers, or drawing pattern detections. These alerts are highly customizable and can be delivered via email, SMS, or in-app notifications, ensuring traders never miss an opportunity or warning.
Social Trading and Community Insights
Trading View’s social networking elements enable users to publish their ideas, comment on others’ analyses, and develop trading communities. The platform’s idea feed showcases trending viewpoints and market predictions, providing diverse perspectives. This democratization of information helps traders validate their strategies and learn from the collective experience.
Market Data and Asset Coverage
Trading View aggregates data from multiple exchanges and data providers, delivering comprehensive coverage of global markets. This integration fosters holistic analysis, enabling traders to compare assets across different markets seamlessly.
Developing Robust Trading Strategies Using Trading View
Chart Types and Technical Indicators
Effective trading strategies begin with selecting appropriate chart types that match your trading style and objectives. Candlestick charts, for instance, are popular for their ability to reveal market sentiment at a glance, while Renko or Kagi charts help filter out market noise to identify clearer trends. Combining these with technical indicators—such as Moving Averages for trend direction or RSI for overbought/oversold conditions—can significantly enhance decision-making.
Customizing Charts for Better Insights
Customization is key to efficient analysis. Traders can modify color schemes, add annotations, draw trendlines, Fibonacci retracements, or head-and-shoulders patterns directly on charts. Saving custom templates allows quick access to preferred setups, saving time during critical moments.
Utilizing Alerts and Automation Features
Automating trade alerts based on predefined criteria ensures timely responses to market movements. Traders can set alerts for price breakouts, indicator crossovers, or pattern formations. Advanced users may leverage Trading View’s Pine Script—a scripting language—to develop custom indicators and automate complex analysis routines, reducing manual effort and increasing precision.
Advanced Market Analysis Techniques
Multi-Asset Analysis with Trading View
Pro traders leverage Trading View’s multi-asset analysis capabilities to synthesize data across different markets. For example, tracking correlations between commodities and currencies or analyzing Bitcoin’s movement relative to tech stocks can reveal macroeconomic trends. Using synchronized charts and multi-pane views facilitates comprehensive analysis and strategic planning.
Implementing Backtesting and Simulation
Backtesting involves applying trading strategies to historical data to evaluate their efficacy. Trading View offers a built-in backtesting environment where traders can simulate trades based on their indicators and rules. This practice helps refine strategies, identify weaknesses, and optimize parameters before deploying them in live markets.
Reading and Interpreting Market Trends
Trend analysis is foundational in trading. Recognizing whether a market is trending or ranging influences trading decisions—whether to follow momentum or to sideline. Techniques like Elliott Wave Theory, support and resistance levels, and volume analysis enhance the trader’s ability to interpret market directions effectively.
Maximizing Performance and Engagement
Integrating Trading View with Other Platforms
For optimal workflow, integrating Trading View with brokerage accounts, portfolio management tools, or other analytical software is essential. Many brokers support direct integration, allowing traders to execute trades without switching platforms, thus reducing latency and execution risk.
Sharing and Collaborating on Trading Ideas
The social aspect encourages community engagement—sharing charts, commentary, and trading strategies boosts collective knowledge. Collaborative tools like published ideas, group chats, and live streams foster a dynamic learning environment, crucial for ongoing skill development.
Monitoring Your Trading Performance
Tracking your trading results is vital for continuous improvement. Trading View allows users to log trades, analyze performance metrics, and review historical analysis to understand profitability, drawdowns, and consistency. These insights are fundamental to evolving a disciplined trading approach.
Future Trends and Innovations in Trading View
Upcoming Features and Developments
Trading View continues to innovate with upcoming features such as AI-powered insights, improved automation capabilities, and enhanced mobile functionalities. Anticipated developments include more robust scripting options, wider asset class coverage, and seamless integration with emerging technologies like blockchain data.
Community Contributions and Social Trading
The growing community fosters crowdsourced analysis, trading competitions, and educational content, enriching platform value. Trader-driven ideas, custom scripts, and tutorials contribute to a vibrant ecosystem that adapts rapidly to market changes and user feedback.
Adapting to Evolving Market Conditions
Market volatility and technological advancements demand agility. Trading View’s adaptive tools—such as real-time news feeds, sentiment analysis, and adaptive alerts—allow traders to respond swiftly to unforeseen market events, securing an edge in volatile environments.